
Ten Years of Logging My Life
I’ve been continuously recording my daily activities by hand since I was 17, amounting to 85,000+ activities over the span of a decade.
Update See Hacker News for 100+ more comments on this post.
Why?!
Self-awareness. Am I getting enough sleep and exercise? Often I become engrossed in whatever I’m doing and forget about biological obligations like eating. My job is cool, but have I been making enough time for other people and hobbies I care about? Balance requires constant attention.
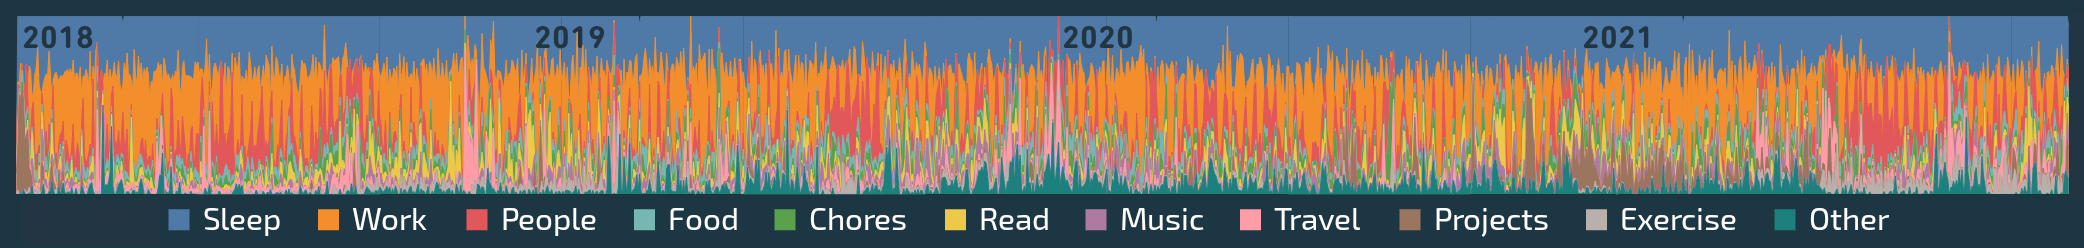
The data is also just endlessly fascinating to sift through. These pixels may not mean much to anyone else, but they tell an intensely personal story of my life’s ups and downs over the past four years:
How I track myself
My log’s first entry is from October 16, 2011, soon after I started college. The original incarnation of the log was a massive spreadsheet in which I recorded a short summary of each day’s happenings alongside a more detailed breakdown of the total hours spent per activity. Some columns’ entries were automatically highlighted to indicate whether I reached certain daily goals, e.g. 8 hours of sleep.
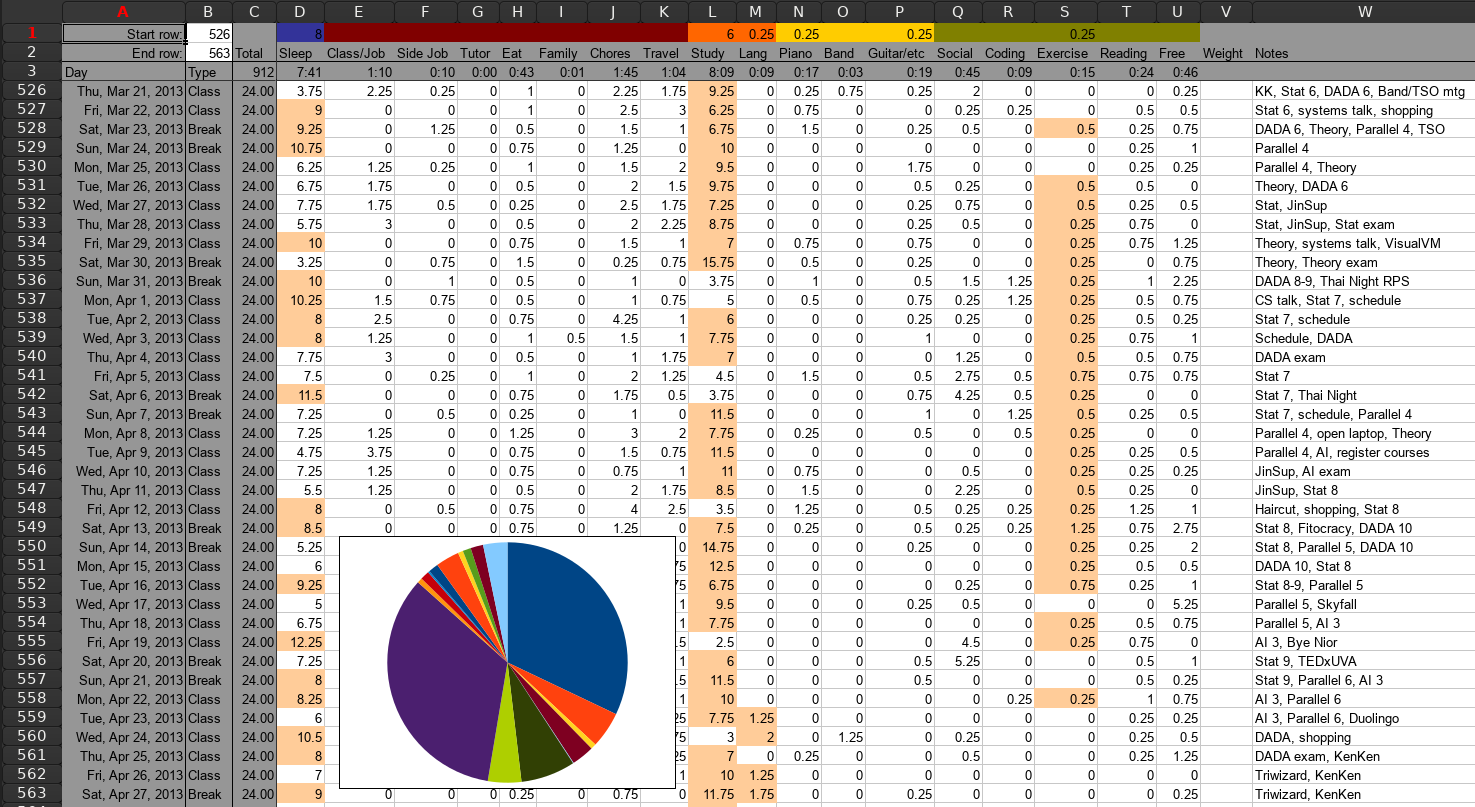
This setup worked fine for the next couple years of college, and with some minor tweaks it continued to carry me through my first four years of full-time work as well.
There was definitely room for improvement, though. I had to either enter activities immediately after they ended or simply try to remember them until I got back to the keyboard. By mentally rounding each activity’s duration to the nearest 15 minutes, I was able to enter data quickly but at the expense of precision. If I were to play piano for two hours, it would appear as a 2 in the spreadsheet but without any start or end time info. Tracking each activity’s geographical location was similarly infeasible.
The solution: developing my own Android app.
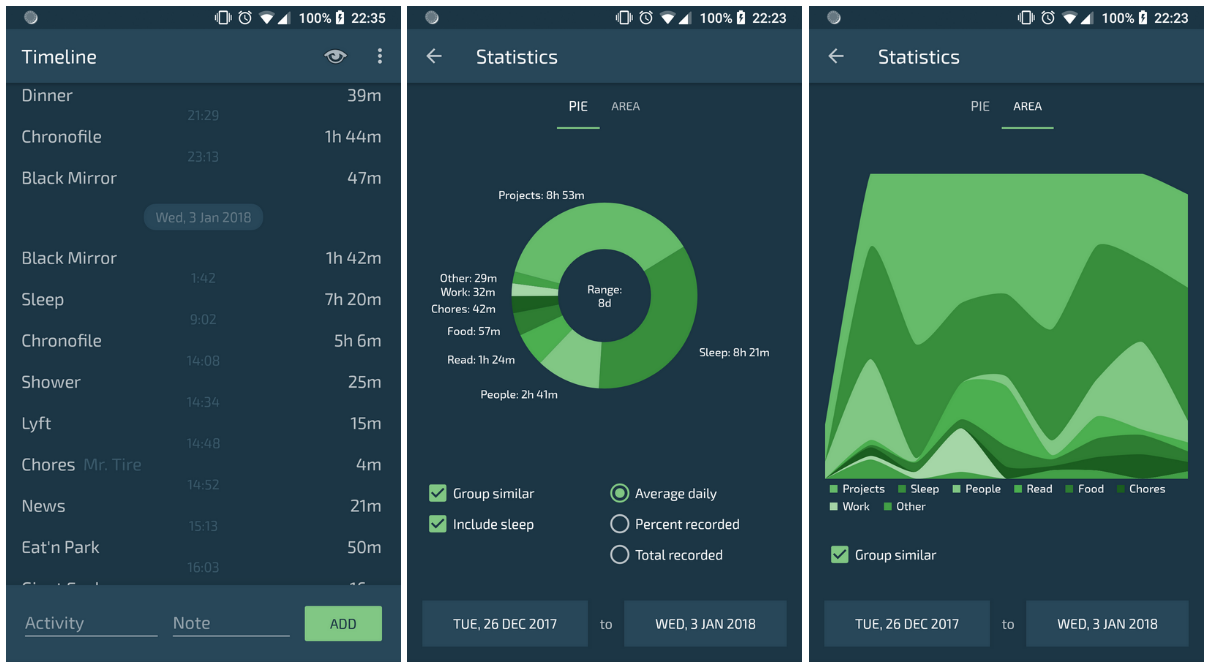
I named it Chronofile, which I later learned was also the name of a similar undertaking by Buckminster Fuller. Its code1 is open source and available on GitHub.
Update Hello Hacker News! As requested, here’s a release APK that you can try installing for yourself on Android 8+. Please open a GitHub issue if you run into any problems with the app.
Update Several years later, I’ve finally gotten around to uploading Chronofile to the Google Play store!
Internally the app saves each log entry as a TSV row containing the activity’s name, descriptive note (optional), latitude, longitude, and start time in seconds since 1970:
Work 40.461583 -79.926864 1639506621
Tapping on an old entry creates a new one for the same activity. Geolocation data comes from GPS. Chronofile’s streamlined interface has cut down the time that I spend tracking myself each day from around ten minutes to less than one minute.
Observations
Turns out I’ve been playing music for an average of 45 minutes a day over the past decade, which is honestly a little embarrassing given that I’m certainly better at it by now but still so far from where I’d like to be. Oh well, no need to be world-class at your hobbies I guess?
I did expect guitalele to top the list but was shocked to see that I’ve sunk 943 hours into this tiny guitar that I picked up for less than $100! Possibly my highest-ROI purchase ever.
Yes I did the quarantine hair thing. Still kinda regret finally cutting it :S
The remaining charts cover only the past four years since it’s too cumbersome to extract this data from the pre-Chronofile spreadsheet era.
Lockdown sticks out like a sore thumb in this one too. It’s a small miracle that my legs still work—there were some months when I didn’t take a single step outside! Most of my pandemic travel has been on long road trips.
Hidden in the chart above are a handful of games, 24 books, 39 shows, 102 movies, and thousands of news articles. I had never really been much into TV, but to stay somewhat social during lockdown I joined a viewing party that ended up covering all the corona classics: Tiger King, Love Is Blind, Avatar, kdrama after kdrama after kdrama…
You can see that “News” went flat for several months in 2021, corresponding to when my TTRSS server abruptly stopped fetching most of my RSS feeds due to some certificate error. Even though reading the news had been such a constant part of my daily life ever since the olden days of Slashdot and Google Reader, it took me five months to even notice this problem!
I have mixed feelings about that. I do think it’s important to know what’s going on in the world, but how much time is worth spending? Hacker News (via hnrss) is an incredibly valuable resource and I can’t imagine having become as good of an engineer without it, but it’s also a bit of an echo chamber. In any case, it’s a relief to have such clear proof that I’m not as addicted to the news as I once suspected.
Notably absent from the chart is social media, which I mostly gave up after high school.
In contrast to the previous chart of passive media consumption, this one maps out “personal productivity” loosely defined as activities that improve myself in some measurable way or make progress toward non-work (unprofessional?) goals.
Occasions when things weren’t all going my way were responsible for a few of the “Music” upticks above. I’ve found that playing music is the best medicine: it uses up vast amounts of physical, emotional, and mental energy that I might otherwise be tempted to spend more counterproductively.
Obviously exercise is good too, but I’ve been less sure about the particular kind. At no point during my first (and probably last) half-marathon in May 2019 or the training for it did I ever experience anything remotely resembling runner’s high, and the pump has never quite done it for me like it does for Arnold. I still lift a bit but most of my exercise nowadays comes from rock climbing and volleyball. As the chart suggests, those have been much more enjoyable to sustain at an average pace above one hour a day.
Monday always feels like the busiest day of my week, which the chart confirms by giving Monday the smallest bubbles of any night. Overall I’m pretty happy with how boring my sleep schedule has become in recent years, a far cry from the chaos of high school.
Some might find this chart more concerning. Is nothing sacred, other than Sunday 7am?! A less alarming interpretation: I have enough freedom in my work life and personal life that I can attend to both whenever it’s most convenient.
For a few months during lockdown, I settled into a pattern where I would handle the more interpersonal aspects of my job in the afternoon, take a long nap in the evening, and do “real work” (i.e. coding) after midnight while free from any distractions. That stands in contrast to most of 2014, when I would head to the gym at 1am, go to bed at 2:30am, wake up at 10:30am—usually right on the minute without an alarm—and sit down in my office chair at 11am.
Which of those two schedules is better? I’ve found that at least for me, biphasic sleep didn’t actually have much of a noticeable effect on my mood or productivity. Just getting 7-8 hours of sleep a day matters much more than how those hours are distributed.
What surprises me most here is the extremely weak correlation between work and sleep, which I suppose is a good thing? Sleep and travel are negatively correlated because I categorize sleep while traveling as travel.
Apart from sleep, work is negatively correlated with everything! That makes sense—I do barely any business travel, for example. Burnout is definitely something to keep in mind here.
This chart may be the hardest of all to interpret. Chronofile’s interface has barely ever changed, so that doesn’t explain any variations here. Adding a new entry takes so little time anyway that I doubt it affects my behavior.
Does lower activity churn equate to better focus, longer attention span? Or should I instead aim for more variety each day? This chart’s shape over time doesn’t match any personal metric that comes to mind: happiness, stress level, body weight, credit score…
A few major life events such as relocations and changes in my *ahem* romantic situation do seem to show up in the chart, but they account for only a small fraction of its peaks and valleys. Is this chart mostly just noise? Maybe any underlying causes here will become more apparent as time goes on.
Conclusions
The quantity of time spent on a given activity doesn’t say much about the quality of that time, of course. And without a control condition, it’s hard to say whether any results of this experiment are causal or simply correlational. That said, I think it’s still worth noting some changes in my own thoughts and behavior that began around the time I started this project.
I get a dramatically more reasonable amount of sleep, a daily average of 7 hours and 38 minutes over the past decade.
I can make everyday plans with greater precision, knowing exactly how many minutes I’ll need to shower or drive or buy groceries or do laundry or water the plants.
I spend much less time on single-player games and idle internet stuff like Reddit. I fairly often still give them my full attention, but for the most part they’re restricted to downtime during other activities like traveling and eating. I don’t mean to suggest that these are bad habits in any practical or moral sense, just that I now have better control over them as opposed to the other way around.
Speaking more generally—although it may sound like Chronofile has taken over my life, it’s really no more stressful or controlling than my car’s speedometer. They’re both tools that do nothing more than show me the results of my own decisions, and it’s now equally hard to imagine flying blind without them.
Chronofile uses RxJava to reimplement Redux (itself inspired by the Elm architecture) with type safety in 9 lines of code, some of the most satisfying that I’ve ever written! ↩